Summary of Mobile Application Quality Standard Scoring Model
Mobile application quality standards through the various aspects of the test process for different dimensions of consideration, and the importance of these dimensions grading, the allocation of different weights to calculate the quality of the test indicators and the overall quality of the standard test standards to quantify the test capacity And the level of application quality.
Mobile application quality standards
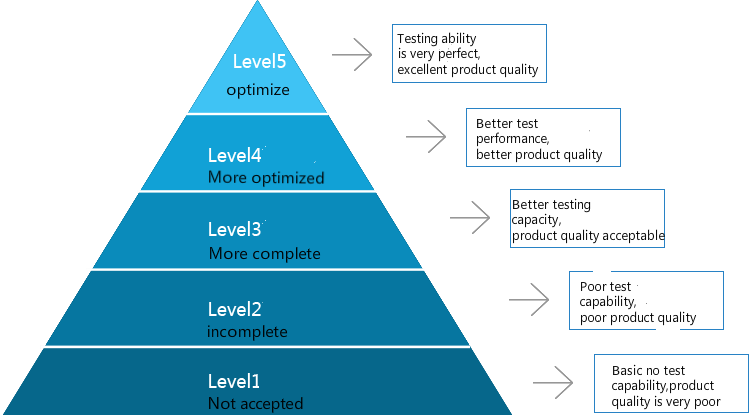
According to the final level of quality standards, the mobile quality standards are divided into five levels:
Detailed rating model
Measure the dimension
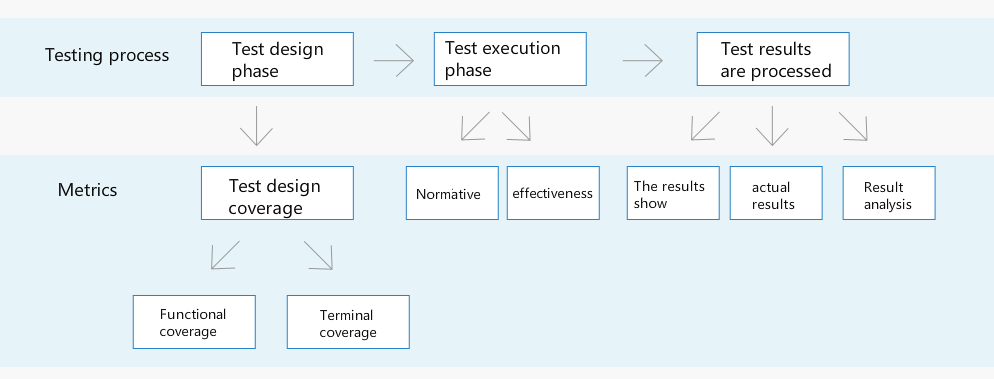
Measure the Dimension Description
| Measure the dimension | description | |
|---|---|---|
| Test design phase | Terminal coverage | Terminal coverage refers to the test to have an impact on the results of a variety of terminal types to test, the terminal types include: a variety of ROM, a variety of mobile phone resolution, a variety of brands, various CPU and so on. Different test indicators, the impact of different factors, making the choice of test terminal type of angle and the number of different |
| Functional coverage | Functional coverage is primarily the breadth and depth of the application's own function. Design test cases first from the user scene, according to different user scenarios designed to test the corresponding test cases | |
| Test execution phase | Normative | Test case in the implementation of the normative, directly affect the accuracy of the test results. Such as the choice of test tools, manual implementation of a rigorous test standard guidance, making the accuracy of test results do not rely on a single person's test capabilities |
| effectiveness | Test efficiency is the cost of manpower, time, etc., which is spent on test execution. Such as automated implementation of test submission, automatic execution of test cases, automatic collection of test results, etc. | |
| Test results are processed | The results show | Through the visual interface to display the test results intuitively, easy to view the test data, and has the analysis of statistical functions. For example, the display includes historical data, the results of the test results, different versions of the comparison, problem positioning and Analysis, etc., through the statistical graphics charts, data trends, etc. show, people are very intuitive to get the information you want, and can easily understand the product quality changes |
| actual results | The actual result is the actual test results after the completion of the test, through, not passed, pass rate and so on intuitively reflected in the established test within the application quality | |
| Result analysis | The positioning of the problems found in the test analysis, processing to solve and optimize product quality | |
Measure the dimension score
For the different dimensions of a single test index, the score is mainly based on the advanced process from low to high level, according to the different stages of the current product, the degree of progress, given the different Score, score can be 5 points system, 100 points system and other different dimensions.
| Measure the dimension | Advanced | |
|---|---|---|
| Test design phase | Terminal coverage | No or for this indicator requirements, covering the terminal type is very small, can not meet the quality requirements - "advanced to, for this indicator requirements, covering all the need to test the type of terminal |
| Functional coverage | No or coverage of scenes and use cases is very small, can not meet the quality requirements ---- "advanced to, for this product and the characteristics of the index covering all the need to cover user scenarios and use cases | |
| Test execution phase | Normative | No or very confusing, can not guarantee the accuracy of the results ---- "advanced to the test tool precision, the test process is very formal |
| effectiveness | Pure manual test ---- "advanced to a key to submit the test, automatic execution, automatic collection of results such as the whole process automation | |
| Test results are processed | The results show | No show or show chaos ---- "advanced to complete display data, analysis of statistical functions, the interface display easy to read beautiful |
| actual results | the results of the pass rate is very low ---- "advanced to, pass rate close to 100% | |
| Result analysis | No analysis ---- "advanced to automatic positioning problems, quick solution | |
importance
Because of the different characteristics of the product, the test indicators have different concerns, according to different indicators and indicators Measure the dimension to develop a different importance level: A, B, C, D, different importance distribution of different computing weights.
| Individual indicators are important to define rules | |
|---|---|
| A | An important indicator of the quality of the product, which affects the product's release, or if the indicator is of poor quality, will seriously affect the user's use or give the user a strong complaint |
| B | For the measurement of product quality play a role, or if the indicators of poor quality, will cause the user to use dissatisfaction |
| C | For the measurement of product quality is less meaningful, or test results on the use of products to users less impact |
| D | To measure the quality of the product does not make much sense, or the test results are good or bad for users to use the product has no effect |
| A single metric, different measure | |
|---|---|
| A | Strong dependence, to measure the ability to test a single index or play a decisive role in quality |
| B | In dependence on the measurement of individual indicators to test the ability or quality to play a greater impact |
| C | Weak dependency, have a certain effect on measuring the ability or quality of a single index, but less impact |
| D | Basically no dependence, to measure the impact of a single index test or quality is very small |
Calculation formula
(1) Overall Quality Standard Score = (Basic Function Test Score + Performance Stability Test Score + Compatibility Test Score + Safety Test Score + Traverse Test Score + Scene Test + Online Quality Control) / 7
(2)Single test dimension score = index 1 score * indicator 1 corresponding weight + index 2 score * indicator 2 corresponding weight + ............ + index n score * index n corresponding weight
(3)Single index score = Measure the dimension1 score * Measure the dimension1 corresponding weight + Measure the dimension2 score * Measure the dimension2 corresponding weight + ............ + Measure the dimensionn score * Measure the dimensionn corresponding weight